I bought a heart-rate strap a while back, and the vendor’s app is a pain to use, so I decided to build my own and figure out how to get real-time heart-rate data through Python.
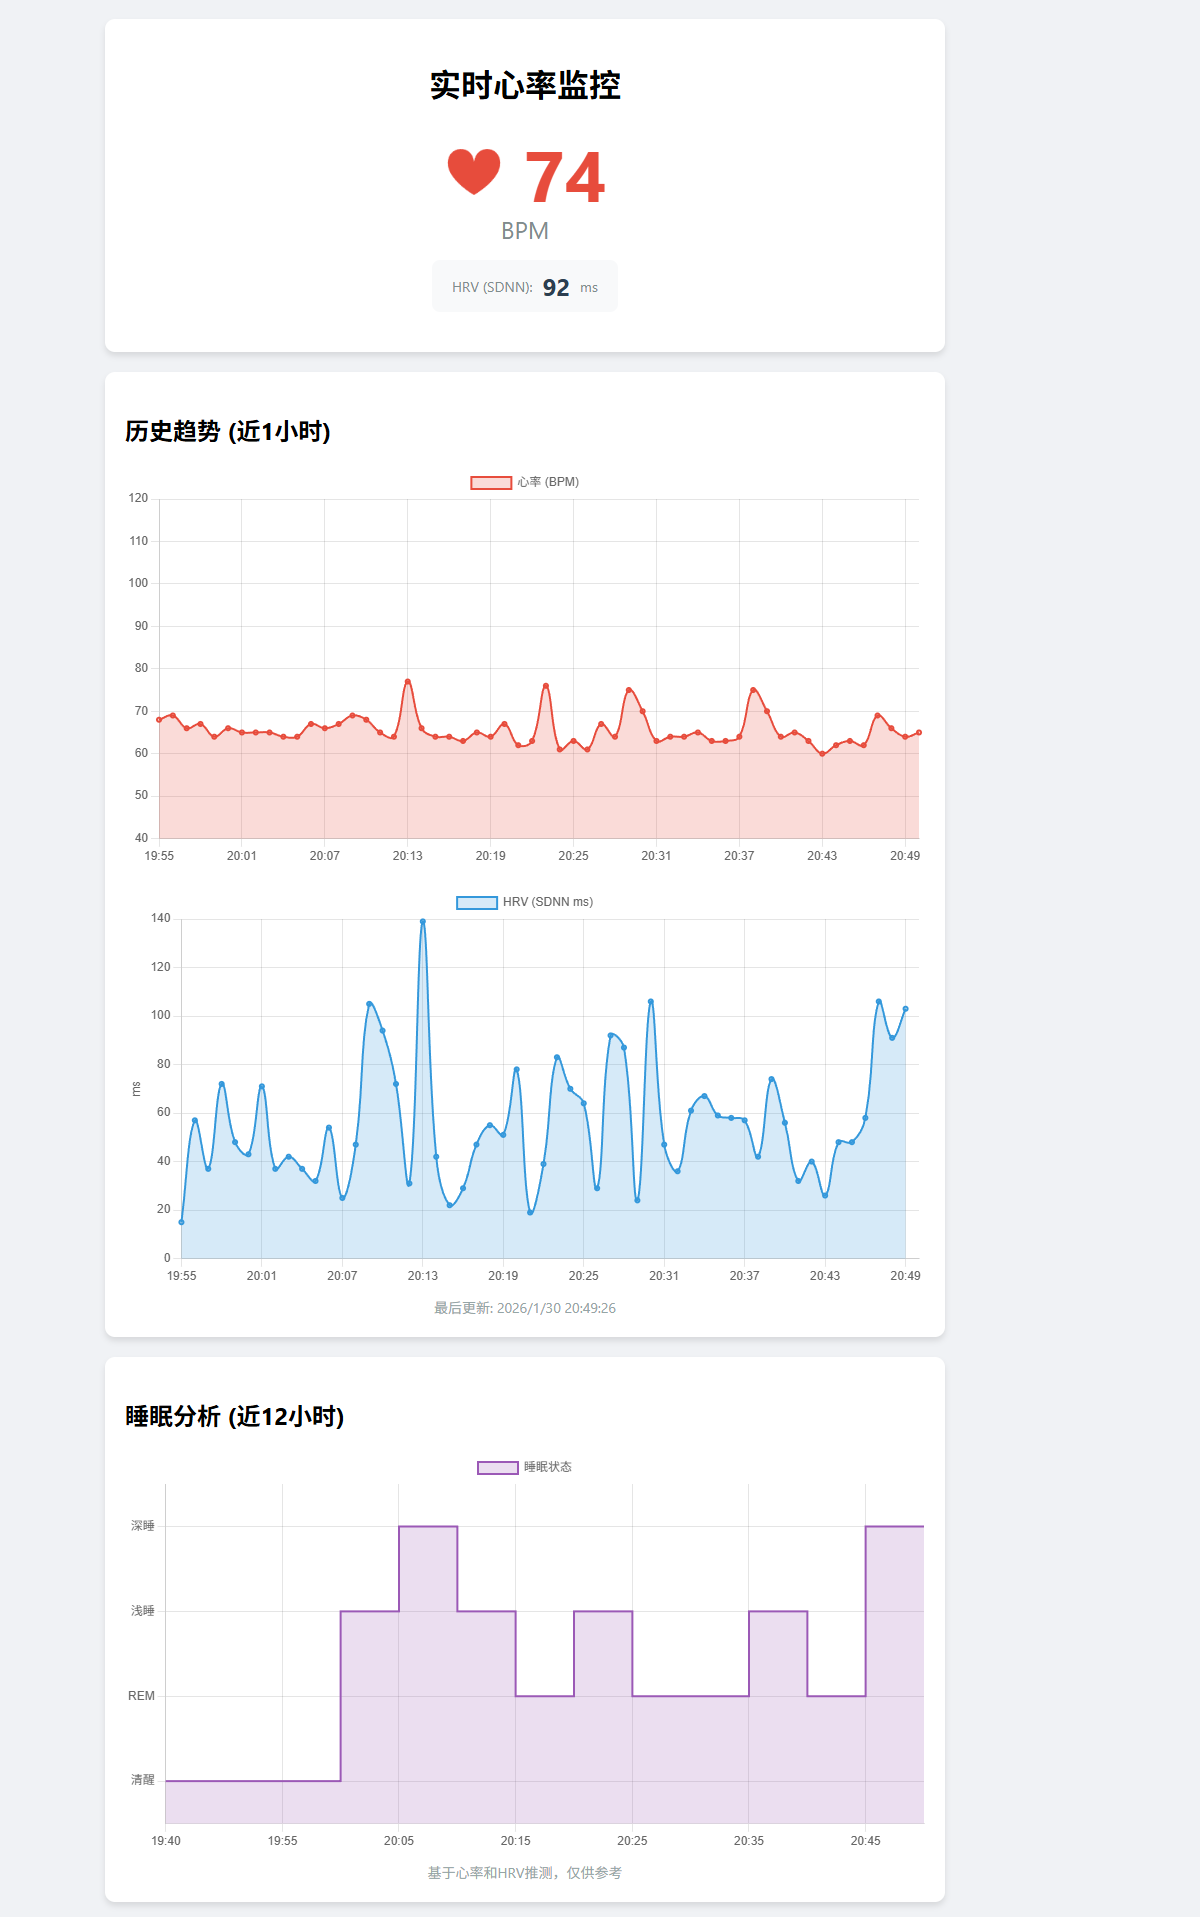
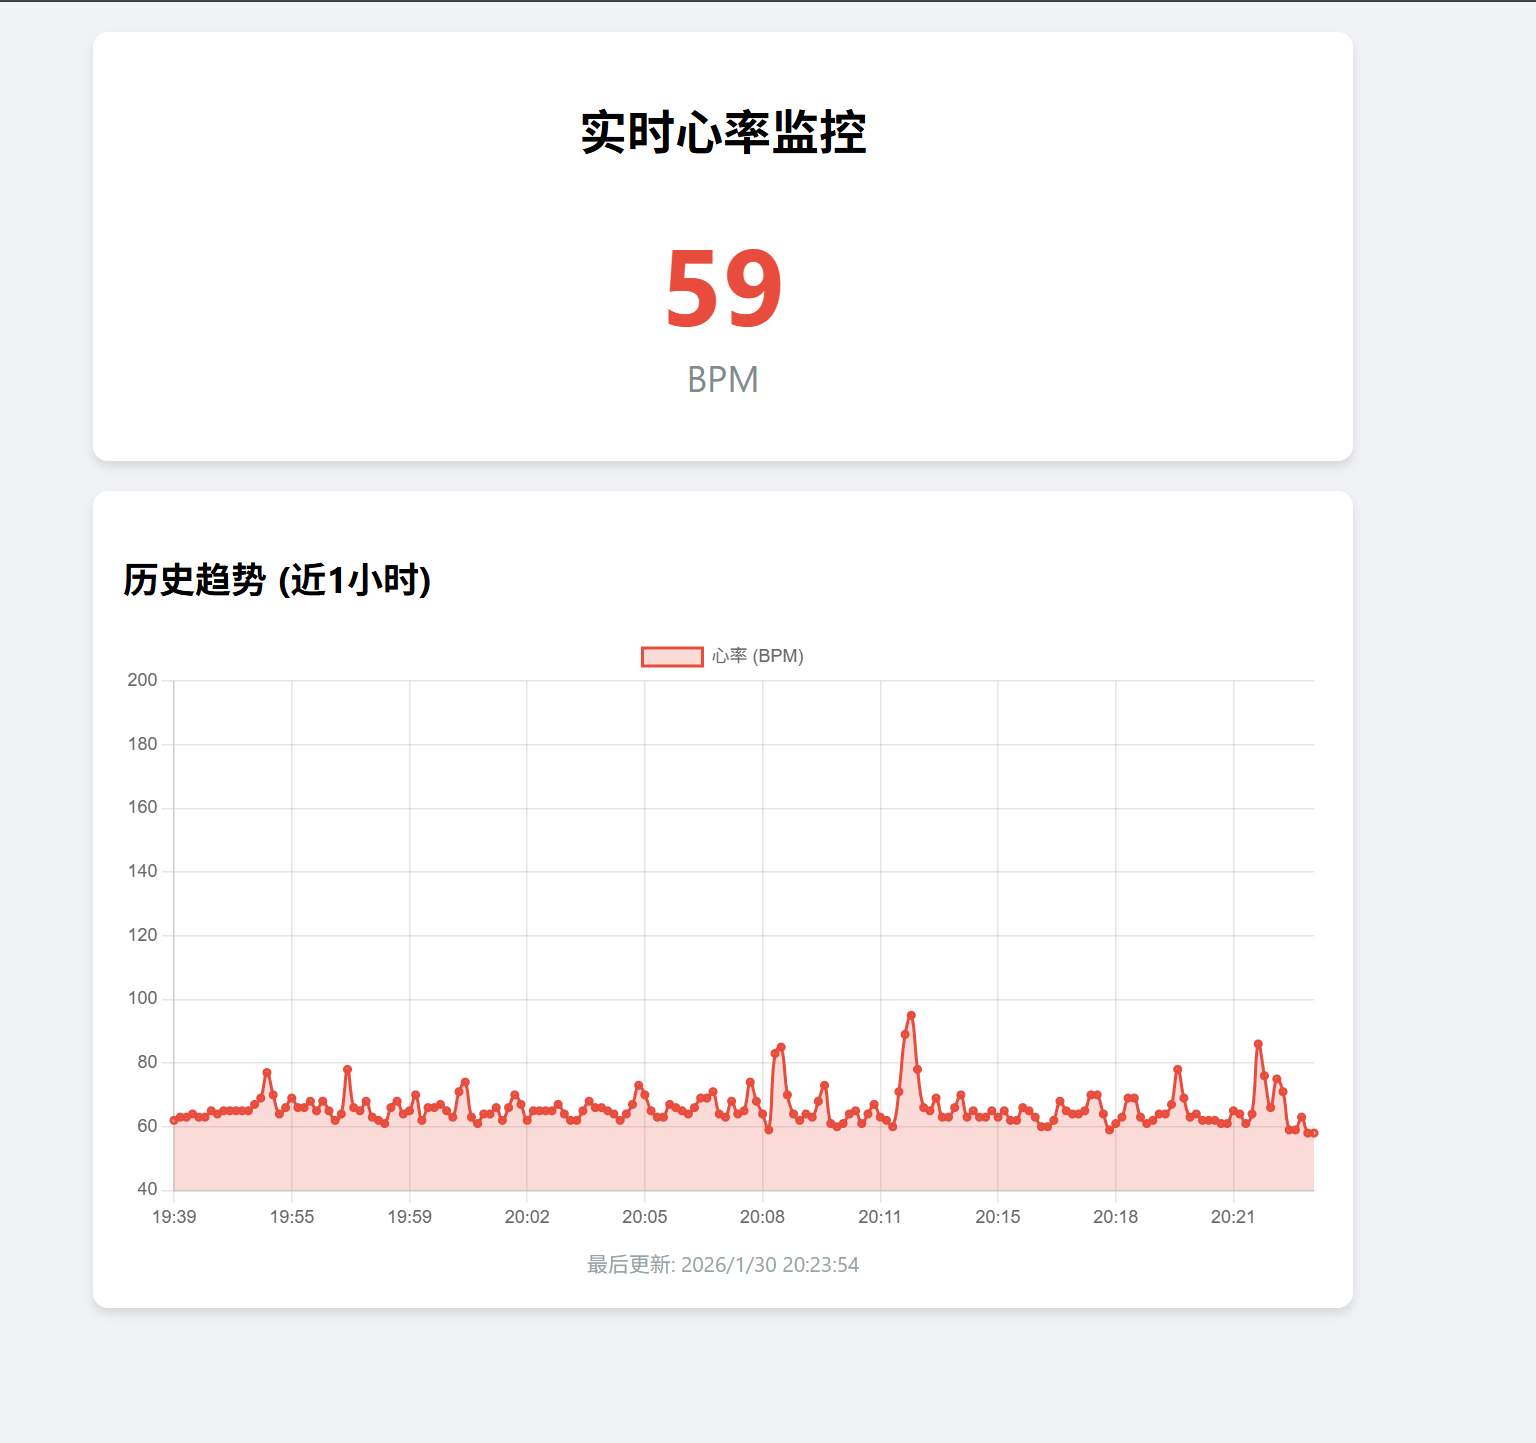
First, the result.
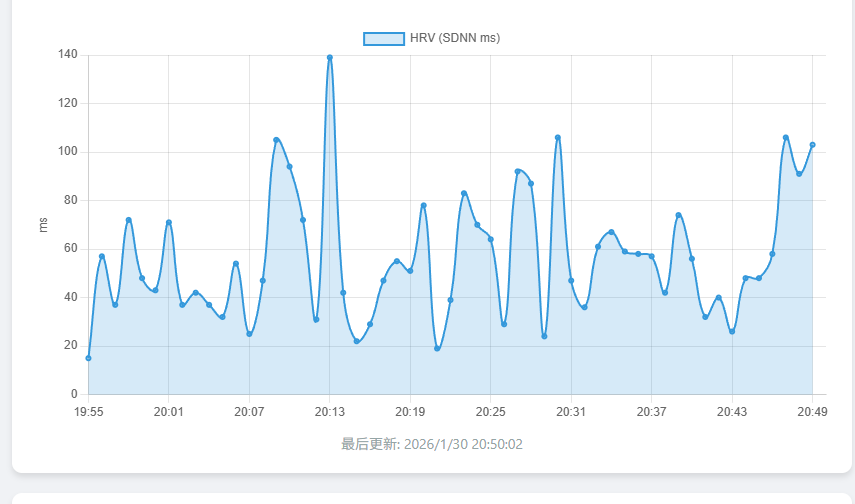
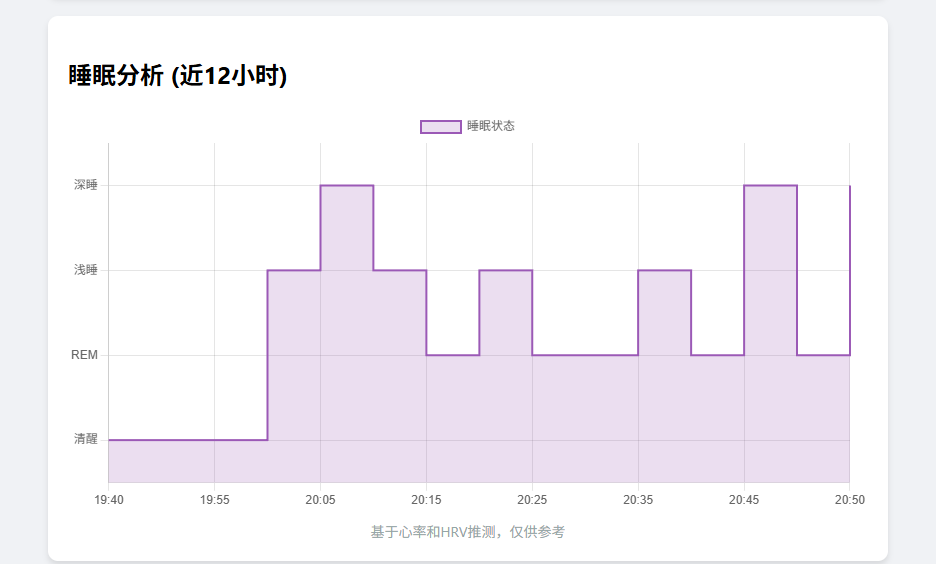
It displays the latest heart-rate data and the historical data in real time.
This article explains how to build a heart-rate viewer page like this with Python. We’ll use bleak + FastAPI + InfluxDB to connect to a Bluetooth heart-rate strap (BLE) and parse the data from the standard Heart Rate Service.
Preparation
We need the bleak library, a cross-platform BLE (Bluetooth Low Energy) client wrapper.
pip install bleak
Core Principles
Most heart-rate straps follow the Bluetooth Heart Rate Service standard:
Service UUID: 0000180d-0000-1000-8000-00805f9b34fb
Characteristic UUID: 00002a37-0000-1000-8000-00805f9b34fb (used to subscribe to notifications)
The heart of it is parsing the byte data in the notification callback:
Flags (1st byte): determines the data format.
Heart Rate Value: depending on bit 0 of Flags, the heart-rate value may be UINT8 (1 byte) or UINT16 (2 bytes).
Installing and Configuring InfluxDB
To persist the heart-rate data, we need to install the time-series database InfluxDB.
Installing InfluxDB
On a Linux environment (such as Ubuntu/Debian), use the following commands:
After installation, InfluxDB runs on port 8086 by default. Open http://localhost:8086 in a browser to complete the initial setup: create the initial user, organization and bucket.
To work with InfluxDB from Python, install the official client library:
pip install influxdb-client
Full Implementation: Bluetooth Reading + Data Storage
The code below shows how to connect to a Bluetooth heart-rate strap, parse the data and write it to InfluxDB.
import asyncio import os import sys from datetime import datetime, timezone from bleak import BleakScanner, BleakClient from influxdb_client import InfluxDBClient, Point from influxdb_client.client.write_api import SYNCHRONOUS
# InfluxDB configuration # It's best to keep sensitive info like the Token in environment variables, or just replace it with your own config INFLUX_TOKEN = os.environ.get("INFLUXDB_TOKEN", "your InfluxDB Token") INFLUX_ORG = os.environ.get("INFLUXDB_ORG", "awen") INFLUX_URL = os.environ.get("INFLUXDB_URL", "http://192.168.1.28:8086") INFLUX_BUCKET = os.environ.get("INFLUXDB_BUCKET", "heart_rate")
# Initialize the InfluxDB client # url: the InfluxDB address # token: the Token used for authentication # org: the organization name influx_client = InfluxDBClient(url=INFLUX_URL, token=INFLUX_TOKEN, org=INFLUX_ORG)
# Initialize the write API in SYNCHRONOUS mode so we continue only after the data is written write_api = influx_client.write_api(write_options=SYNCHRONOUS)
# Standard Bluetooth Heart Rate Service UUID HEART_RATE_SERVICE_UUID = "0000180d-0000-1000-8000-00805f9b34fb" # Heart Rate Measurement characteristic UUID HEART_RATE_MEASUREMENT_UUID = "00002a37-0000-1000-8000-00805f9b34fb"
defnotification_handler(sender, data): """Handle the incoming Bluetooth notification data""" try: # Parse the Bluetooth Heart Rate Measurement data format # The 1st byte is Flags; bit 0 determines the heart-rate value format flag_byte = data[0] is_uint16 = flag_byte & 0x01
if is_uint16: # If 16-bit, read bytes 2 and 3 (little-endian) heart_rate = int.from_bytes(data[1:3], byteorder='little') else: # If 8-bit, read byte 2 heart_rate = data[1]
# Build the InfluxDB data point # Measurement: heart_rate (like a table name) # Tag: device=ble_hr_monitor (indexed column, for fast queries) # Field: bpm=heart_rate (the actual value) # Time: current UTC time point = Point("heart_rate") \ .tag("device", "ble_hr_monitor") \ .field("bpm", heart_rate) \ .time(datetime.now(timezone.utc))
# Write the data write_api.write(bucket=INFLUX_BUCKET, org=INFLUX_ORG, record=point) except Exception as e: print(f"Failed to process or write data: {e}", file=sys.stderr)
asyncdefscan_for_device(): print("Scanning for Bluetooth devices...") # Scan for 5 seconds devices = await BleakScanner.discover(return_adv=True, timeout=5.0)
# Match by Service UUID first for device, adv_data in devices.values(): if"0000180d-0000-1000-8000-00805f9b34fb"in adv_data.service_uuids: print(f"*** Found heart-rate device (UUID): {device.name} ({device.address}) ***") return device
# If not found automatically by UUID, try fuzzy matching by name for device, adv_data in devices.values(): if device.name and ("Heart"in device.name or"HRM"in device.name or"Polar"in device.name or"Garmin"in device.name): print(f"*** Found heart-rate device (name): {device.name} ({device.address}) ***") return device
returnNone
asyncdefrun_ble_client(): """Main loop: scan, connect and keep the connection alive""" whileTrue: target_device = await scan_for_device()
try: asyncwith BleakClient(target_device.address, disconnected_callback=on_disconnect) as client: print(f"Connected: {client.is_connected}")
# Subscribe to notifications; notification_handler fires when data arrives await client.start_notify(HEART_RATE_MEASUREMENT_UUID, notification_handler) print("Listening for heart-rate data... (keeping the connection open)")
# Block here until the connection drops await disconnected_event.wait()
except Exception as e: print(f"Connection error: {e}")
print("Connection lost or closed; restarting scan in 5 seconds...") await asyncio.sleep(5)
if __name__ == "__main__": try: asyncio.run(run_ble_client()) except KeyboardInterrupt: print("Program stopped manually by the user") finally: print("Closing the database connection...") write_api.close() influx_client.close()
Once the script is running, data flows continuously into InfluxDB.
Data Visualization API (FastAPI)
With data in hand, we can write a simple API to serve it to the front end. We’ll use FastAPI.
pip install fastapi uvicorn
Create a main.py file:
import os from typing importList from datetime import datetime, timedelta, timezone from fastapi import FastAPI, HTTPException from fastapi.staticfiles import StaticFiles from fastapi.responses import HTMLResponse from influxdb_client import InfluxDBClient from pydantic import BaseModel
app = FastAPI() # Mount the static file directory for js/css and the like app.mount("/static", StaticFiles(directory="."), name="static")
classHeartRatePoint(BaseModel): time: str bpm: int
@app.get("/api/heart-rate/latest", response_model=HeartRatePoint) defget_latest_heart_rate(): """Get the latest heart-rate data from InfluxDB""" # Query with the Flux language # range(start: -1h): look at the past 1 hour of data # last(): take the final record query = f''' from(bucket: "{INFLUX_BUCKET}") |> range(start: -1h) |> filter(fn: (r) => r["_measurement"] == "heart_rate") |> filter(fn: (r) => r["_field"] == "bpm") |> last() ''' result = query_api.query(org=INFLUX_ORG, query=query)
ifnot result orlen(result) == 0: raise HTTPException(status_code=404, detail="No data found")
for table in result: for record in table.records: return HeartRatePoint( time=record.get_time().isoformat(), bpm=int(record.get_value()) )
raise HTTPException(status_code=404, detail="No data found")
@app.get("/api/heart-rate/history", response_model=List[HeartRatePoint]) defget_heart_rate_history(minutes: int = 60): """Get the heart-rate history trend over a recent period""" # aggregateWindow: downsample to one average every 10 seconds, to keep the front end from having too many points query = f''' from(bucket: "{INFLUX_BUCKET}") |> range(start: -{minutes}m) |> filter(fn: (r) => r["_measurement"] == "heart_rate") |> filter(fn: (r) => r["_field"] == "bpm") |> aggregateWindow(every: 10s, fn: mean, createEmpty: false) |> yield(name: "mean") ''' result = query_api.query(org=INFLUX_ORG, query=query)
points = [] if result: for table in result: for record in table.records: points.append(HeartRatePoint( time=record.get_time().isoformat(), bpm=int(record.get_value()) )) return points
@app.get("/") defread_root(): """Return a simple HTML page""" withopen("index.html", "r", encoding="utf-8") as f: html_content = f.read() return HTMLResponse(content=html_content, status_code=200)
if __name__ == "__main__": import uvicorn uvicorn.run(app, host="0.0.0.0", port=8000)
A Simple Web Monitoring Page
Create an index.html file that uses Chart.js to draw a real-time line chart.
评论
0 条评论