Stats Overlay 可视化功能的实现原理解析
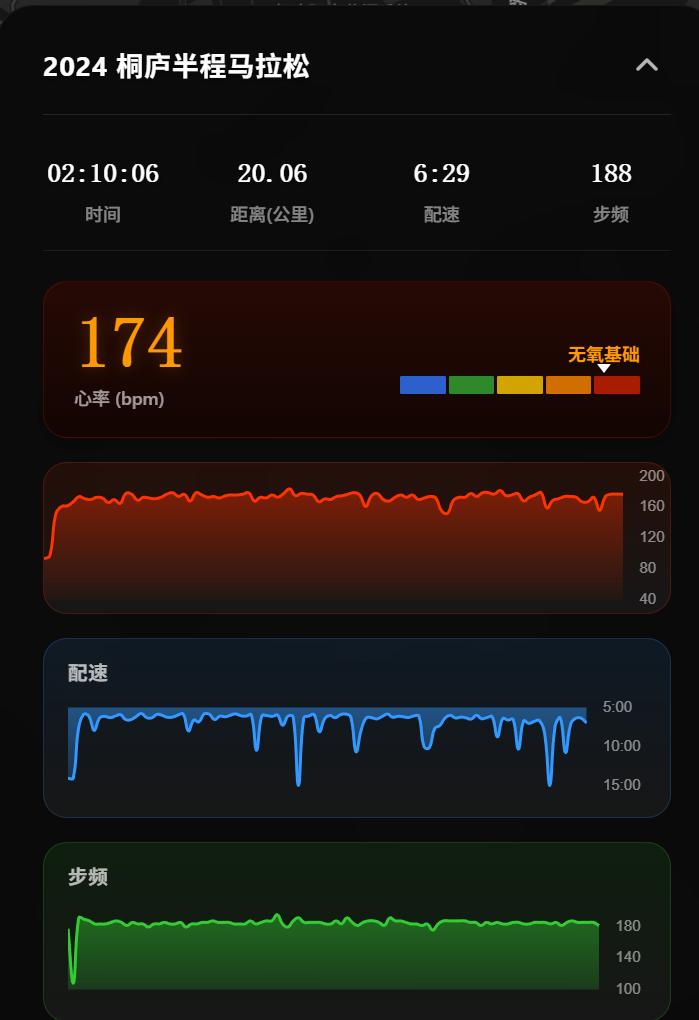
在博客主题的开发中,为了提升首页的视觉冲击力和互动性,我们在 Hero Splash(首屏动画)中加入了一个 “Stats Overlay”(数据统计浮层)。这个浮层用于实时显示马拉松轨迹动画过程中的关键数据(如时间、距离、配速、心率等)。 本文将深入解析这个功能的实现原理,涵盖 HTML 结构、C...
Hello everyone, I'm Awen. I have previously worked at UPYUN, NetEase and Youzan. I'm also an expert author and lecturer at CSDN, having previously taught at Geek Academy and CSDN Academy, where I delivered courses including Cisco CCNA, Redis from Entry to Proficiency, and Redis Interview Essentials.
🥾 In my spare time, I love running, hiking and participating in marathons. My personal best is 2 hours 02 minutes achieved at the Hefei Half Marathon in November 2025.
📝 This is my personal blog, which mainly records my thoughts and reflections related to work and life.
📧 For relevant cooperation inquiries, please contact me at: hi@awen.me
在博客主题的开发中,为了提升首页的视觉冲击力和互动性,我们在 Hero Splash(首屏动画)中加入了一个 “Stats Overlay”(数据统计浮层)。这个浮层用于实时显示马拉松轨迹动画过程中的关键数据(如时间、距离、配速、心率等)。 本文将深入解析这个功能的实现原理,涵盖 HTML 结构、C...
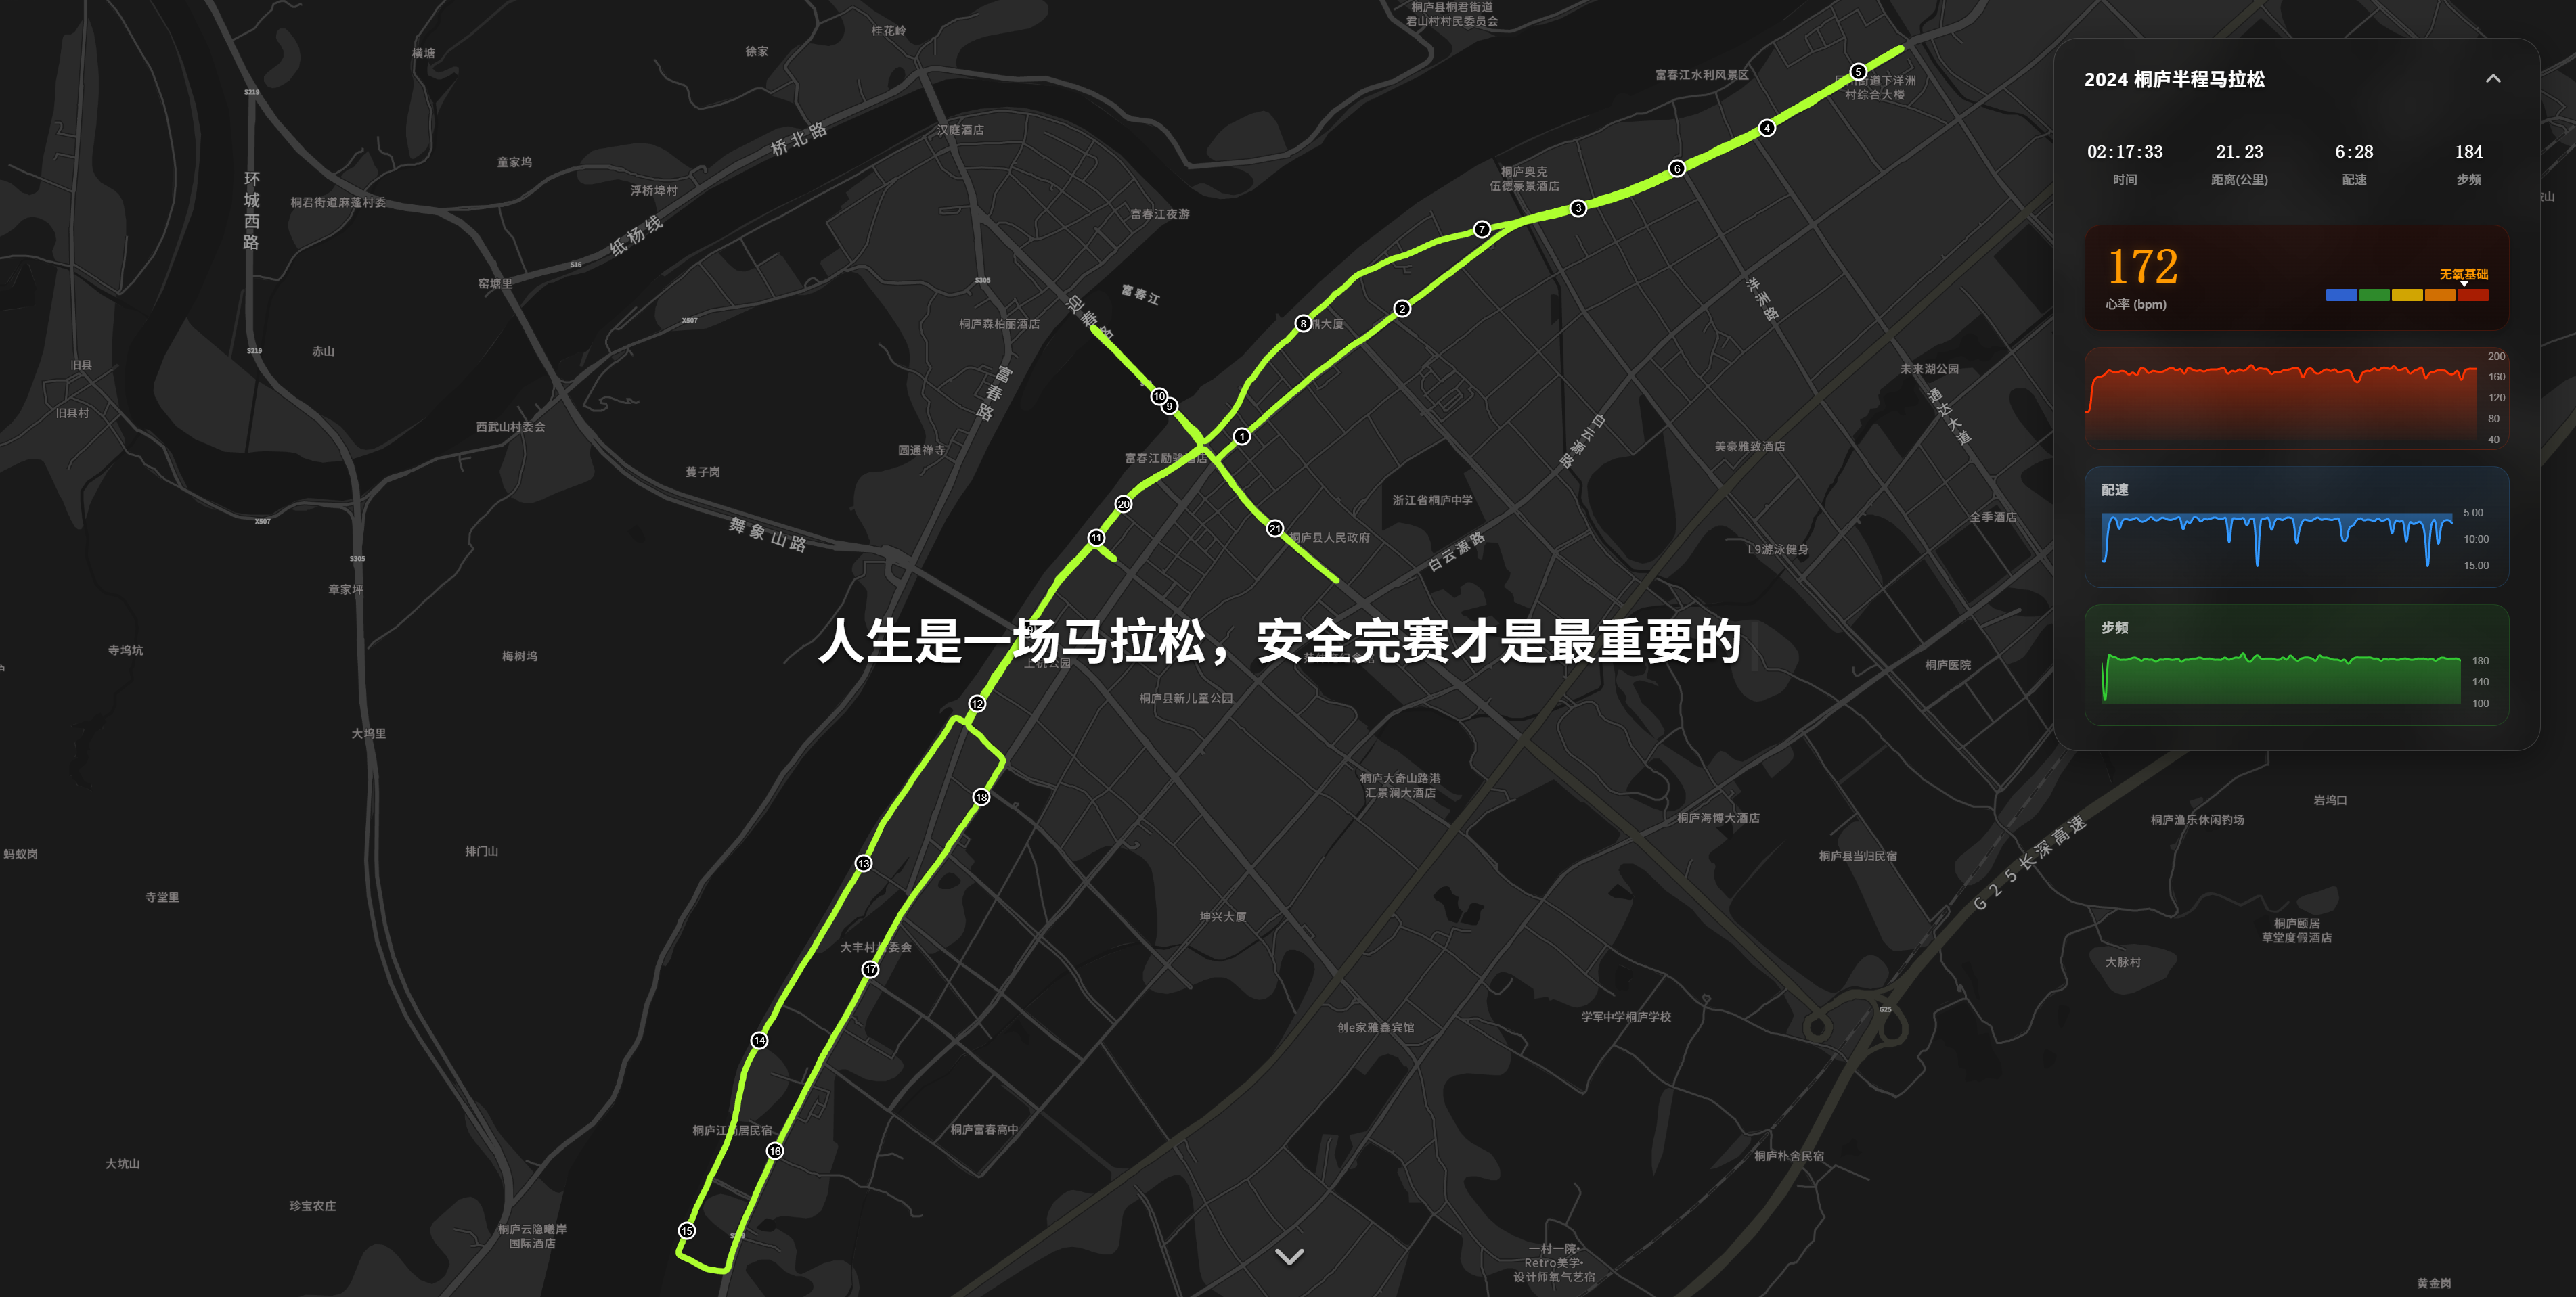
作为一名热爱跑步的程序员,我一直想把自己的马拉松经历以一种独特的方式呈现在博客上。普通的文字和静态图片虽然能记录当下,但无法还原那 21.0975 公里的心路历程。 于是,我决定在博客的首屏实现一个动态的运动轨迹可视化效果:以高德地图为画布,实时绘制 GPX 轨迹,并同步展示心率、配速、步频等专业运...