mysql> show variables like '%slow_query_log%'
    -> ;
+---------------------+-------------------------------+
| Variable_name       | Value                         |
+---------------------+-------------------------------+
| slow_query_log      | OFF                           |
| slow_query_log_file | /var/lib/mysql/mysql-slow.log |
+---------------------+-------------------------------+
2 rows in set (0.00 sec)
开启
mysql> set global slow_query_log=1;
Query OK, 0 rows affected (0.00 sec)
然后看状态
mysql> show variables like ‘%slow_query_log%’; +———————+——————————-+ | Variable_name | Value | +———————+——————————-+ | slow_query_log | ON | | slow_query_log_file | /var/lib/mysql/mysql-slow.log | +———————+——————————-+ 2 rows in set (0.00 sec)
使用set global slow_query_log=1开启了慢查询日志只对当前数据库生效,如果MySQL重启后则会失效。如果要永久生效,就必须修改配置文件my.cnf(其它系统变量也是如此)。例如如下所示:
[root@mysql ~]# vim /etc/my.cnf
slow_query_log=1
slow_query_log_file=/var/lib/mysql/mysql-slow.log
mysql> show variables like '%long_query_time%';
+-----------------+-----------+
| Variable_name   | Value     |
+-----------------+-----------+
| long_query_time | 10.000000 |
+-----------------+-----------+
1 row in set (0.00 sec)
设置值
mysql> set global long_query_time=5;
Query OK, 0 rows affected (0.00 sec)

mysql> show variables like '%long_query_time%';
+-----------------+-----------+
| Variable_name   | Value     |
+-----------------+-----------+
| long_query_time | 10.000000 |
+-----------------+-----------+
1 row in set (0.01 sec)
如上所示,我修改了变量long_query_time,但是查询变量long_query_time的值还是10,难道没有修改到呢?注意:使用命令 set global long_query_time=5修改后,需要重新连接或新开一个会话才能看到修改值。你用show variables like ‘long_query_time’查看是当前会话的变量值,你也可以不用重新连接会话,而是用show global variables like ‘long_query_time’; 如下所示:
mysql> show global variables like 'long_query_time';
+-----------------+----------+
| Variable_name   | Value    |
+-----------------+----------+
| long_query_time | 5.000000 |
+-----------------+----------+
1 row in set (0.00 sec)
我们设置long_query_time的值为2
mysql> set global long_query_time=2;
Query OK, 0 rows affected (0.00 sec)

mysql> show global variables like 'long_query_time';
+-----------------+----------+
| Variable_name   | Value    |
+-----------------+----------+
| long_query_time | 2.000000 |
+-----------------+----------+
1 row in set (0.00 sec)
然后执行一条超时5秒的语句(需要重新连接mysql)
    [root@mysql ~]# mysql -u root -p
Enter password:
Welcome to the MySQL monitor.  Commands end with ; or \g.
Your MySQL connection id is 4
Server version: 5.7.21-log MySQL Community Server (GPL)

Copyright (c) 2000, 2018, Oracle and/or its affiliates. All rights reserved.

Oracle is a registered trademark of Oracle Corporation and/or its
affiliates. Other names may be trademarks of their respective
owners.

Type 'help;' or '\h' for help. Type '\c' to clear the current input statement.

mysql> show variables like 'long_query_time';
+-----------------+----------+
| Variable_name   | Value    |
+-----------------+----------+
| long_query_time | 2.000000 |
+-----------------+----------+
1 row in set (0.02 sec)

mysql> select sleep(5)
    -> ;
+----------+
| sleep(5) |
+----------+
|        0 |
+----------+
1 row in set (5.01 sec)
然后查看慢日志可以看到类似信息
[root@mysql ~]# cat /var/lib/mysql/mysql-slow.log /usr/sbin/mysqld, Version:5.7.21 (MySQL Community Server (GPL)). started with: Tcp port:3306 Unix socket:/var/lib/mysql/mysql.sock Time Id Command Argument /usr/sbin/mysqld, Version:5.7.21-log (MySQL Community Server (GPL)). started with: Tcp port:0 Unix socket:/var/lib/mysql/mysql.sock Time Id Command Argument # Time: 2018-02-09T06:59:47.782111Z # User@Host: root[root] @ localhost [] Id: 4 # Query_time: 5.000252 Lock_time: 0.000000 Rows_sent: 1 Rows_examined: 0 SET timestamp=1518159587; select sleep(5);
mysql> show variables like '%log_output%';
+---------------+-------+
| Variable_name | Value |
+---------------+-------+
| log_output    | FILE  |
+---------------+-------+
1 row in set (0.01 sec)
设置为表
mysql> set global log_output='TABLE'; Query OK, 0 rows affected (0.00 sec)
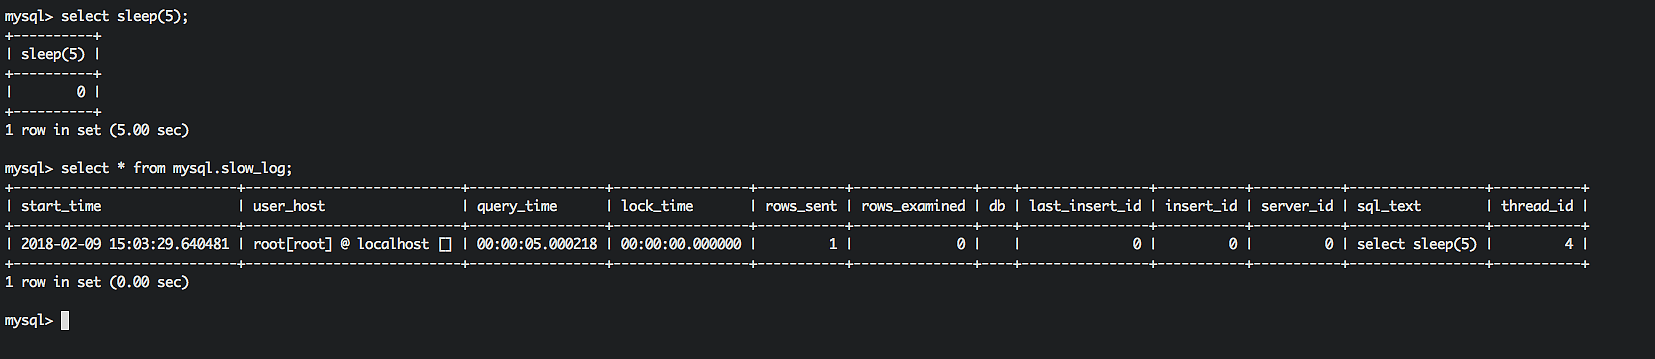
mysql> show variables like '%log_output%'; +---------------+-------+ | Variable_name | Value | +---------------+-------+ | log_output | TABLE | +---------------+-------+ 1 row in set (0.00 sec) mysql> select sleep(5); +----------+ | sleep(5) | +----------+ | 0 | +----------+ 1 row in set (5.00 sec)
系统变量log-queries-not-using-indexes:未使用索引的查询也被记录到慢查询日志中(可选项)。如果调优的话,建议开启这个选项。另外,开启了这个参数,其实使用full index scan的sql也会被记录到慢查询日志。
mysql> show variables like 'log_queries_not_using_indexes';
+-------------------------------+-------+
| Variable_name                 | Value |
+-------------------------------+-------+
| log_queries_not_using_indexes | OFF   |
+-------------------------------+-------+
1 row in set (0.00 sec)

mysql> set global log_queries_not_using_indexes=1;
Query OK, 0 rows affected (0.00 sec)

mysql> show variables like 'log_queries_not_using_indexes';
+-------------------------------+-------+
| Variable_name                 | Value |
+-------------------------------+-------+
| log_queries_not_using_indexes | ON    |
+-------------------------------+-------+
1 row in set (0.00 sec)

mysql> show variables like 'log_slow_admin_statements'; +---------------------------+-------+ | Variable_name | Value | +---------------------------+-------+ | log_slow_admin_statements | OFF | +---------------------------+-------+ 1 row in set (0.00 sec)
mysql>
mysql> set global log_slow_admin_statements=1;
Query OK, 0 rows affected (0.01 sec)

mysql> show variables like 'log_slow_admin_statements';
+---------------------------+-------+
| Variable_name             | Value |
+---------------------------+-------+
| log_slow_admin_statements | ON    |
+---------------------------+-------+
1 row in set (0.00 sec)
查询有多少条慢日志,可以使用系统变量
mysql> show global status like '%slow_queries%';
+---------------+-------+
| Variable_name | Value |
+---------------+-------+
| Slow_queries  | 2     |
+---------------+-------+
1 row in set (0.01 sec)
Parse andsummarizethe MySQL slow query log. Options are
--verbose verbose --debug debug --help write this text to standard output
-v verbose -d debug -s ORDER what to sort by (al, at, ar, c, l, r, t), 'at' is default al: average lock time ar: average rows sent at: average query time c: count l: lock time r: rows sent t: query time -r reversethe sort order (largest lastinstead offirst) -t NUM just show the top n queries -a don't abstract all numbers to N and strings to 'S' -n NUM abstract numbers withat least n digits within names -g PATTERN grep: only consider stmts that include this string -h HOSTNAME hostname of db server for *-slow.log filename (can be wildcard), default is '*', i.e. match all -i NAME nameof server instance (if using mysql.server startup script) -l don't subtract lock timefrom total time
-s, 是表示按照何种方式排序,
c: 访问计数

l: 锁定时间

r: 返回记录

t: 查询时间

al:平均锁定时间

ar:平均返回记录数

at:平均查询时间
-t, 是top n的意思,即为返回前面多少条的数据;
-g, 后边可以写一个正则匹配模式,大小写不敏感的;
例如
得到返回记录集最多的10个SQL。
mysqldumpslow -s r -t 10 /mysql/mysql06_slow.log
得到访问次数最多的10个SQL
mysqldumpslow -s c -t 10 /mysql/mysql06_slow.log
得到按照时间排序的前10条里面含有左连接的查询语句。
mysqldumpslow -s t -t 10 -g “left join” /mysql/mysql06_slow.log
另外建议在使用这些命令时结合 | 和more 使用 ,否则有可能出现刷屏的情况。
mysqldumpslow -s r -t 20 /mysql/mysql06-slow.log| more
评论
0 条评论