kibana下载
在这里下载
修改配置文件
[root@centos config]# cat kibana.yml
# Kibana is served by a back end server. This setting specifies the port to use.
server.port: 5601

# Specifies the address to which the Kibana server will bind. IP addresses and host names are both valid values.
# The default is 'localhost', which usually means remote machines will not be able to connect.
# To allow connections from remote users, set this parameter to a non-loopback address.
server.host: "0.0.0.0"
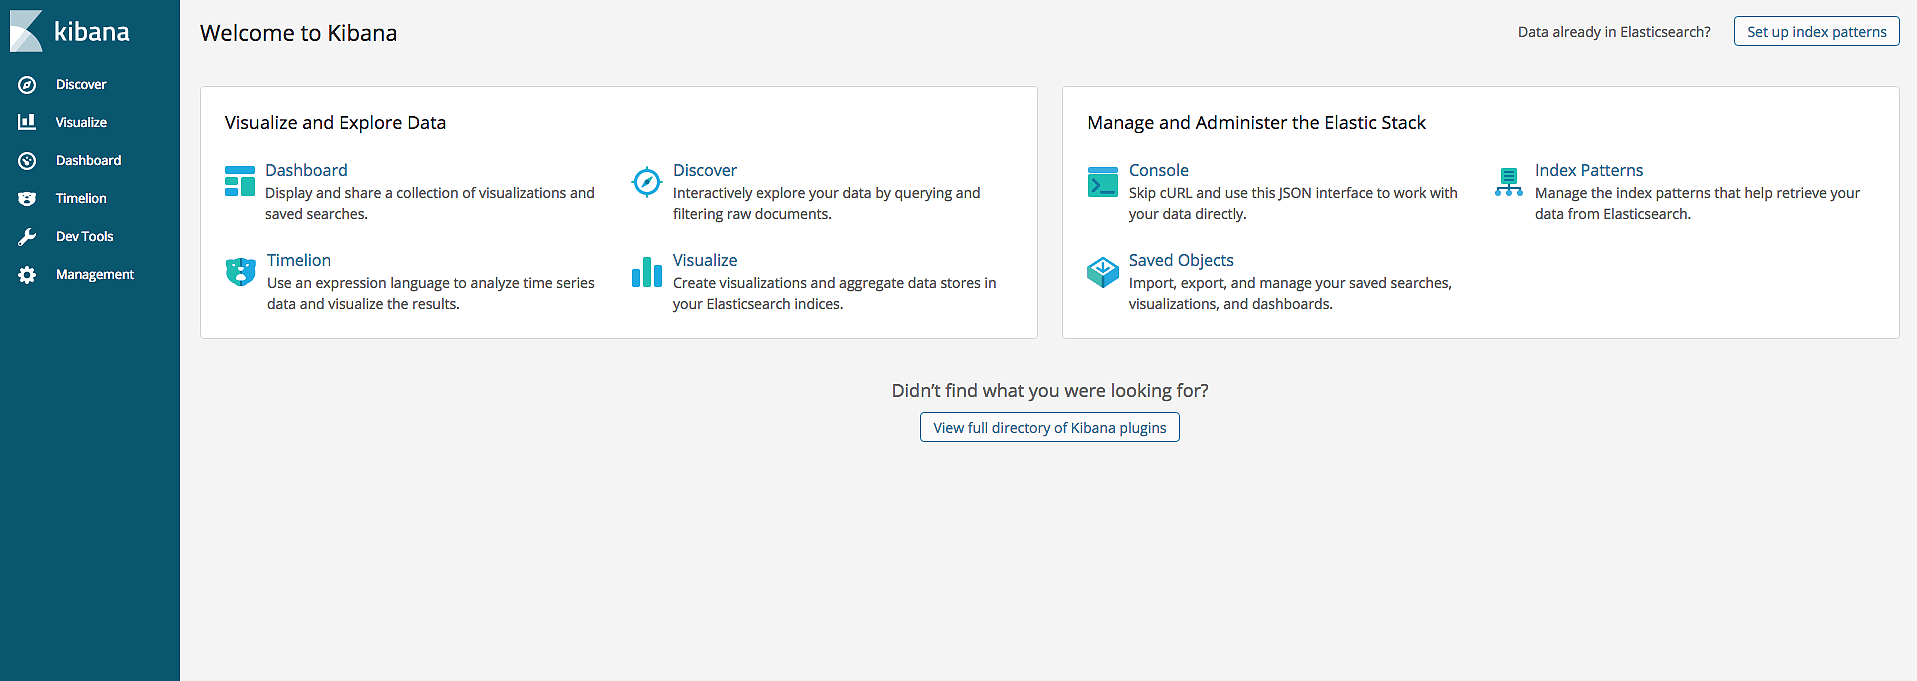
运行
[root@centos bin]# ./kibana
  log   [03:45:26.232] [info][status][plugin:kibana@6.1.0] Status changed from uninitialized to green - Ready
  log   [03:45:26.299] [info][status][plugin:elasticsearch@6.1.0] Status changed from uninitialized to yellow - Waiting for Elasticsearch
  log   [03:45:26.369] [info][status][plugin:console@6.1.0] Status changed from uninitialized to green - Ready
  log   [03:45:26.450] [info][status][plugin:metrics@6.1.0] Status changed from uninitialized to green - Ready
  log   [03:45:26.600] [info][status][plugin:elasticsearch@6.1.0] Status changed from yellow to green - Ready
  log   [03:45:26.849] [info][status][plugin:timelion@6.1.0] Status changed from uninitialized to green - Ready
  log   [03:45:26.853] [info][listening] Server running at http://0.0.0.0:5601
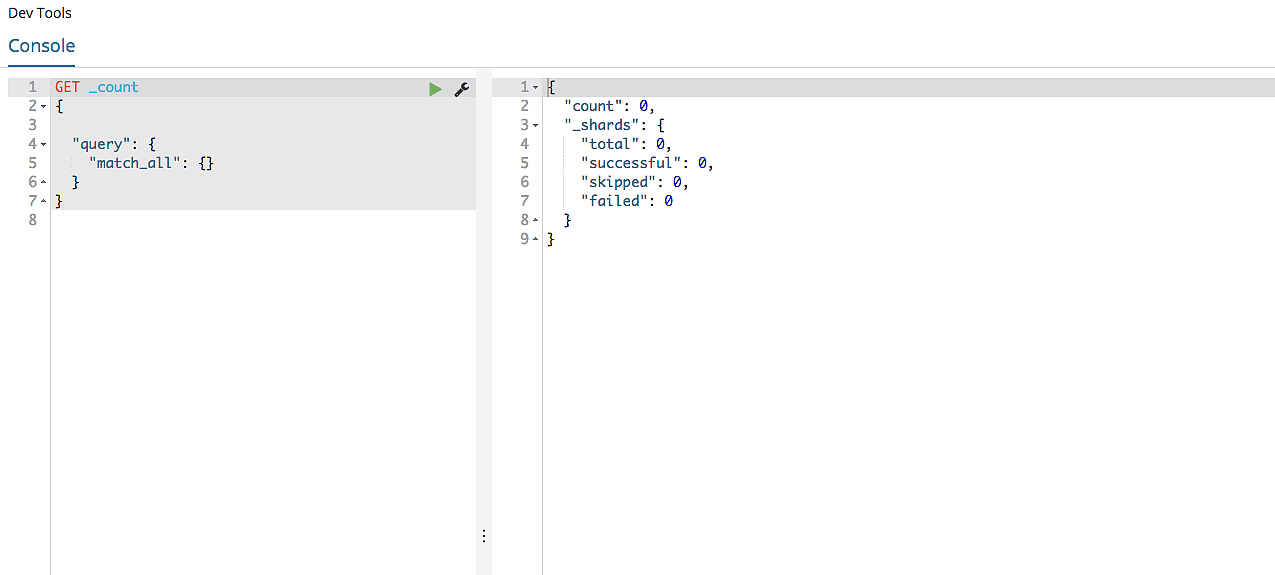
点击 console,可以调试 elasticsearch
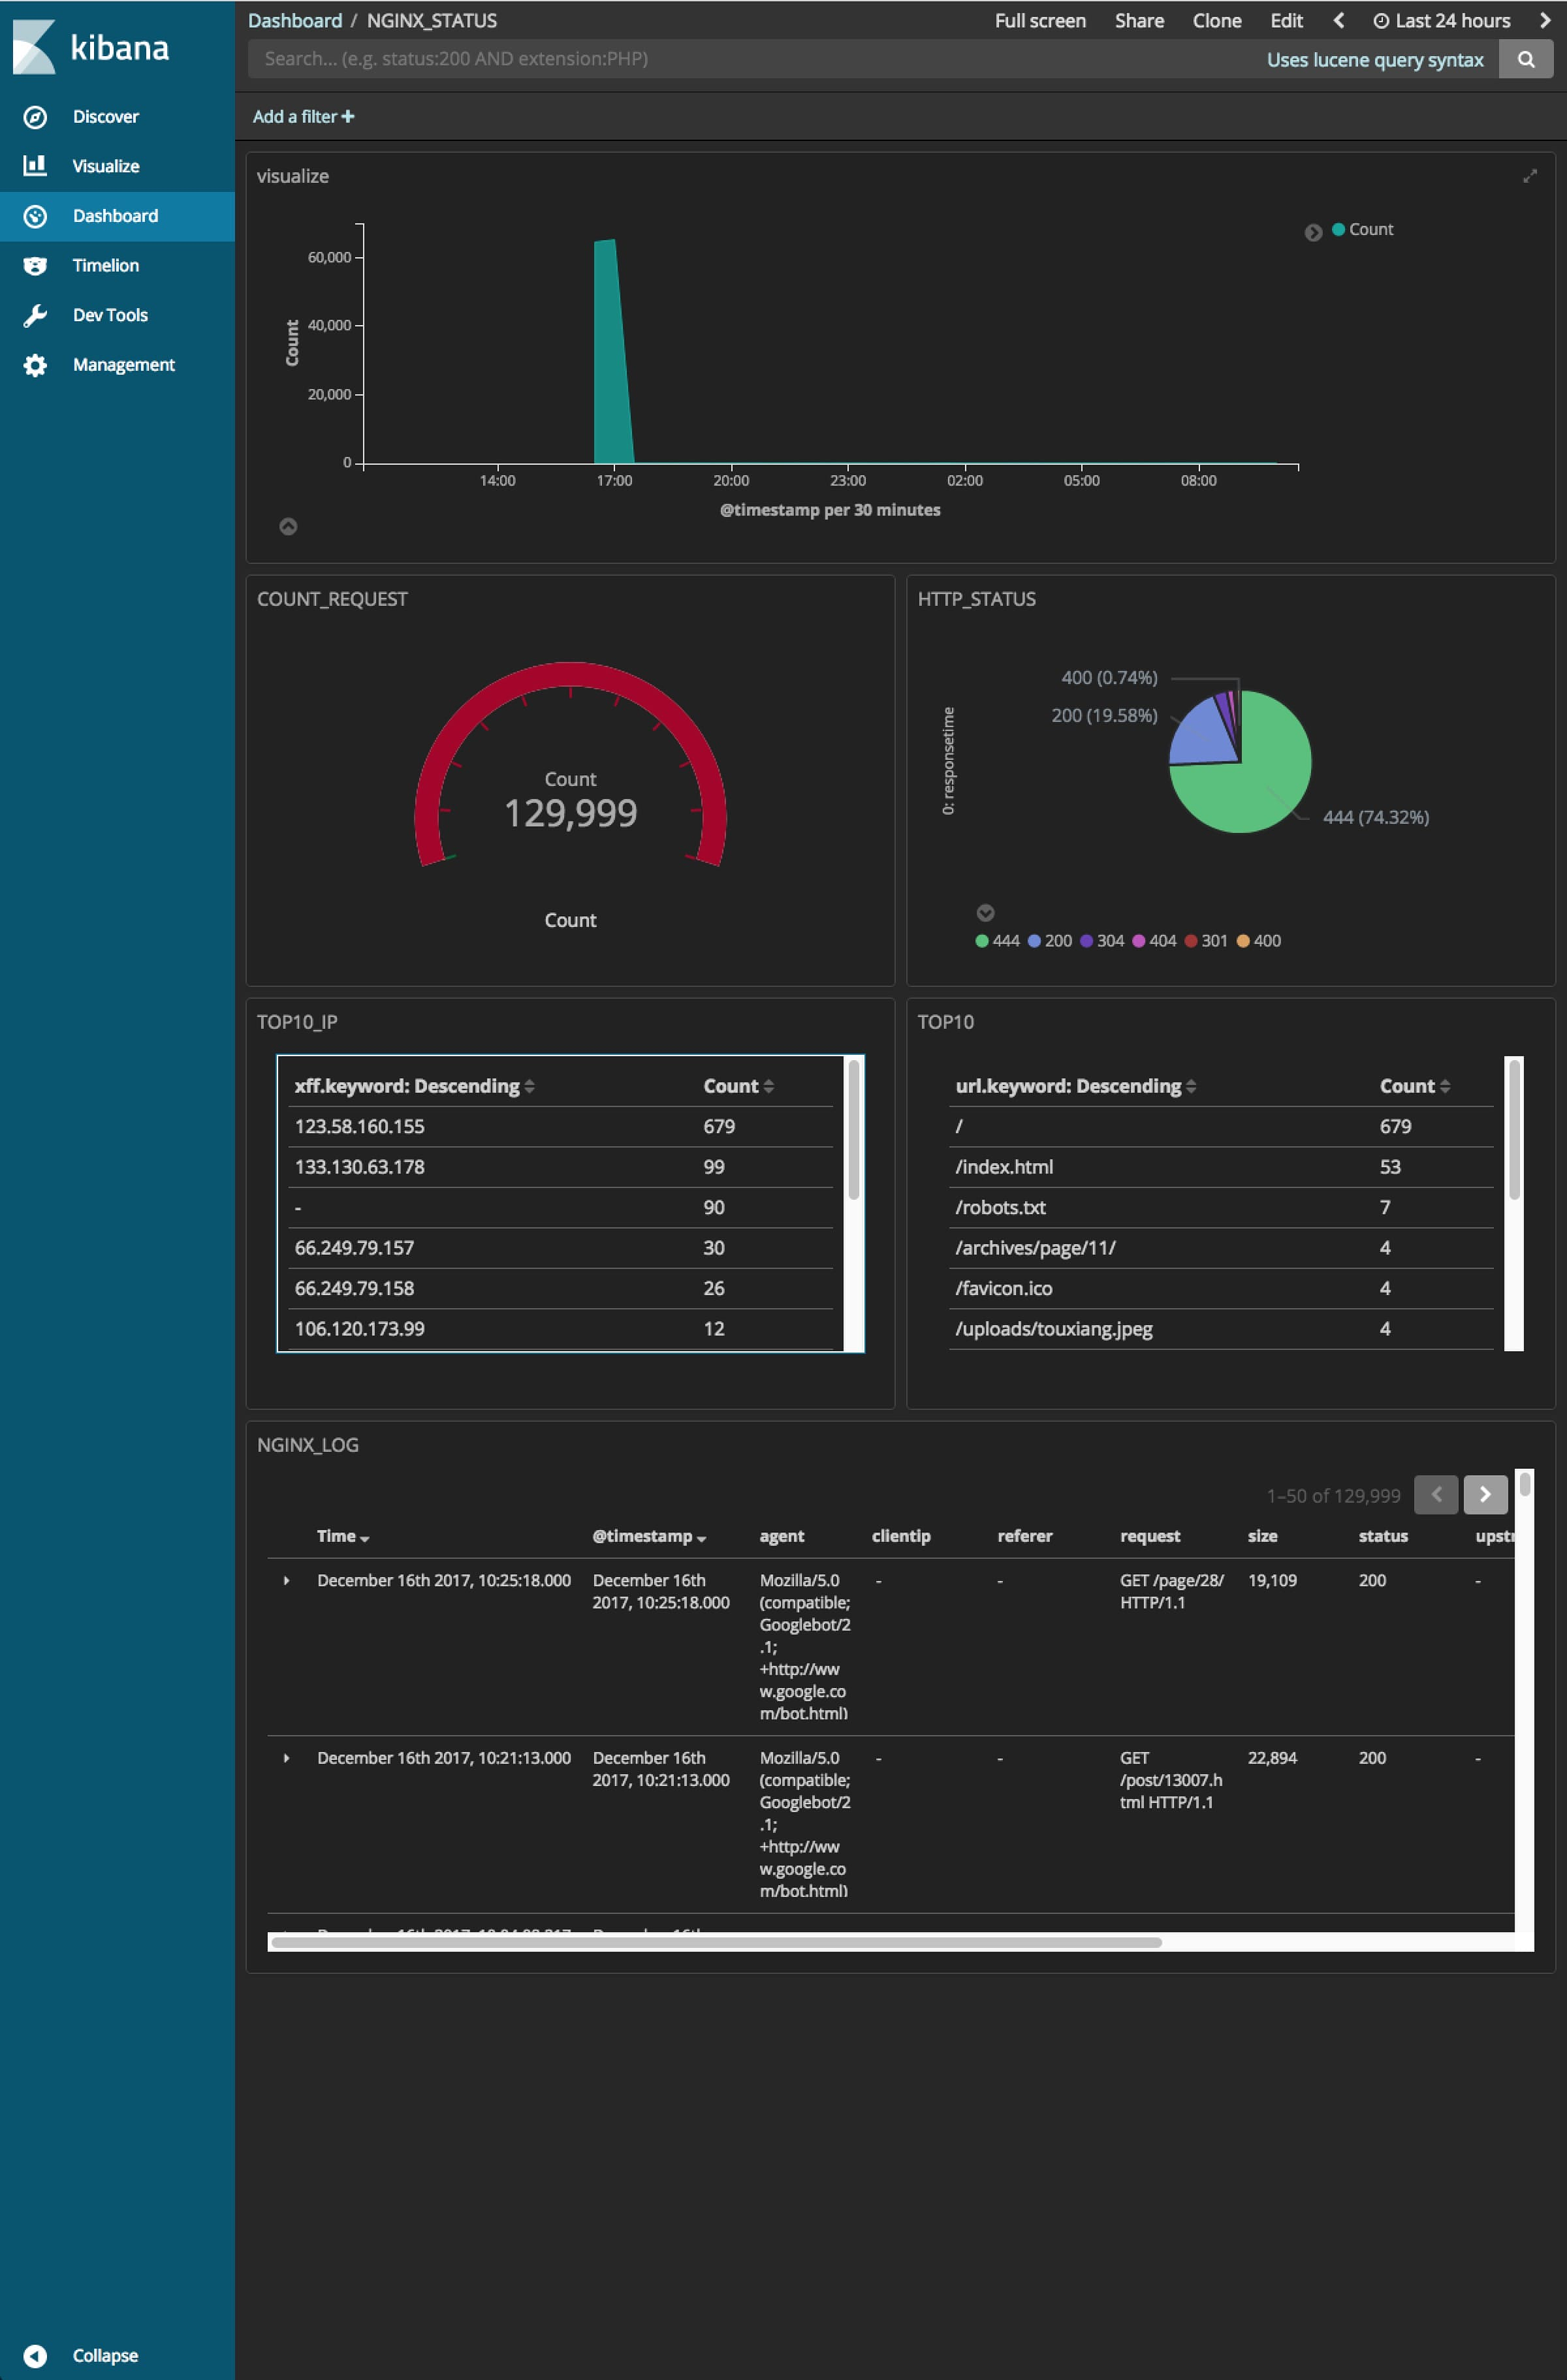
结合 logstash + elasticsearch + kibana 可以配置如图所示的监控
版权声明:本博客所有文章除特别声明外,均采用 CC BY-NC-SA 4.0 许可协议。转载请注明来自 阿文的博客!
评论
0 条评论