While developing the blog theme, to boost the homepage’s visual impact and interactivity, we added a “Stats Overlay” to the Hero Splash (the hero-screen animation). This overlay displays the key data from the marathon track animation in real time (such as time, distance, pace and heart rate).
This article takes a deep dive into how this feature works, covering the HTML structure, the CSS styling and the JavaScript interaction logic.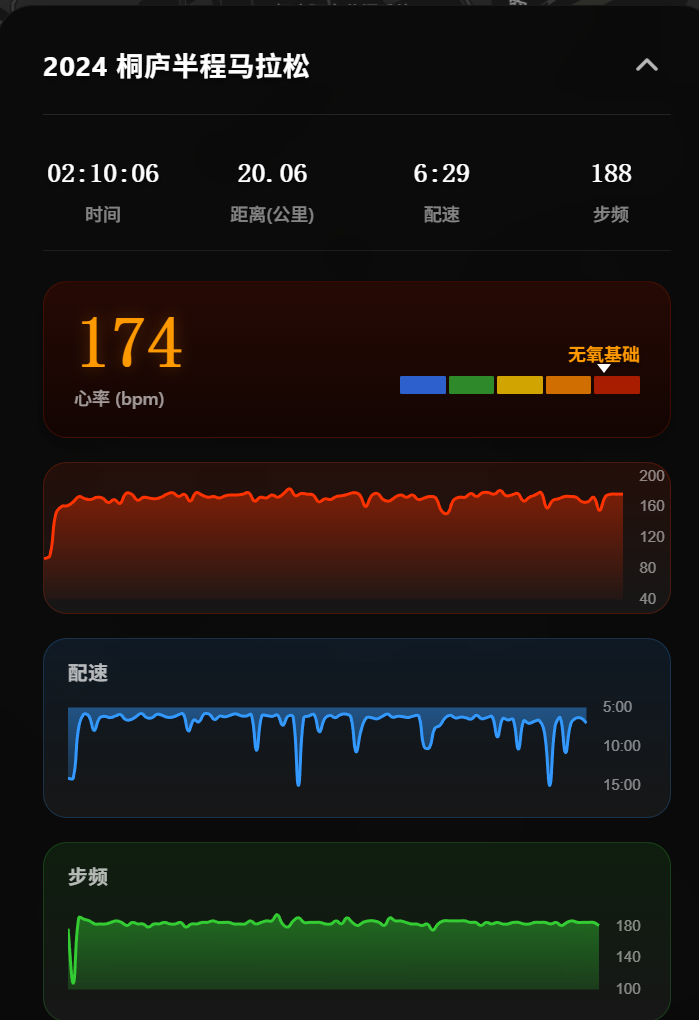
1. Core Feature Overview
The Stats Overlay’s main job is to show the current workout data in sync while the map track animation plays. It has these characteristics:
- Dynamic show/hide: it fades in automatically in step with the track animation’s progress.
- Real-time updates: as each animation frame renders, it computes and shows the data for the current position in real time.
- Interactivity: it supports collapse/expand and adapts to mobile display.
2. HTML Structure Design
The feature is embedded in layout.ejs as part of #hero-splash. Structurally it has two main parts: the summary data area (Always Visible) and the detailed chart area (Collapsible).
|
3. CSS Styles and Transition Animation
The styles are defined in style.styl. To achieve a smooth reveal, we use a CSS Transition.
The key is the switch between the initial state and the .visible state of .stats-overlay:
|
Note: in practice you’d usually set the initial opacity to 0, then add the .visible class via JS to set it to 1, achieving the fade-in effect.
4. JavaScript Logic
The logic lives mainly in the <script> tag of layout.ejs; the core is the animate function and DOM manipulation.
4.1 The Show-Trigger Logic
In the marathon track animation’s render loop animate(timestamp), there’s a block of code dedicated to controlling the Overlay’s display:
|
This logic ensures the data overlay only appears once the track animation actually starts, avoiding an abrupt look during initial page load.
4.2 Real-Time Data Updates
On every animation frame, JS computes, from the current animation progress (the ease variable), which data point should be shown:
|
4.3 Overall Show/Hide Control (SessionStorage)
So as not to bother the user on later visits, we use sessionStorage to record whether the user has already seen the splash animation:
|
When the user scrolls or triggers an interaction, the hideSplash() function is called, storing the splashVisited flag in SessionStorage and hiding the entire Splash layer, including the Stats Overlay.
5. Summary
The Stats Overlay is a typical front-end visualization case that combines:
- DOM manipulation: dynamic style changes via class toggling.
- CSS3 animation: smooth visual transitions via
transition. - Data-driven views: real-time UI updates based on the timeline (RequestAnimationFrame).
- UX optimization: use SessionStorage to avoid repeated displays, respecting the user’s habits.
This approach delivers a cool visual effect while balancing performance and user experience—ideal for the personalized display of a personal blog.
评论
0 条评论